TankCheck.com.au

Loss Monitoring To Meet Regulations

Tank Charts.

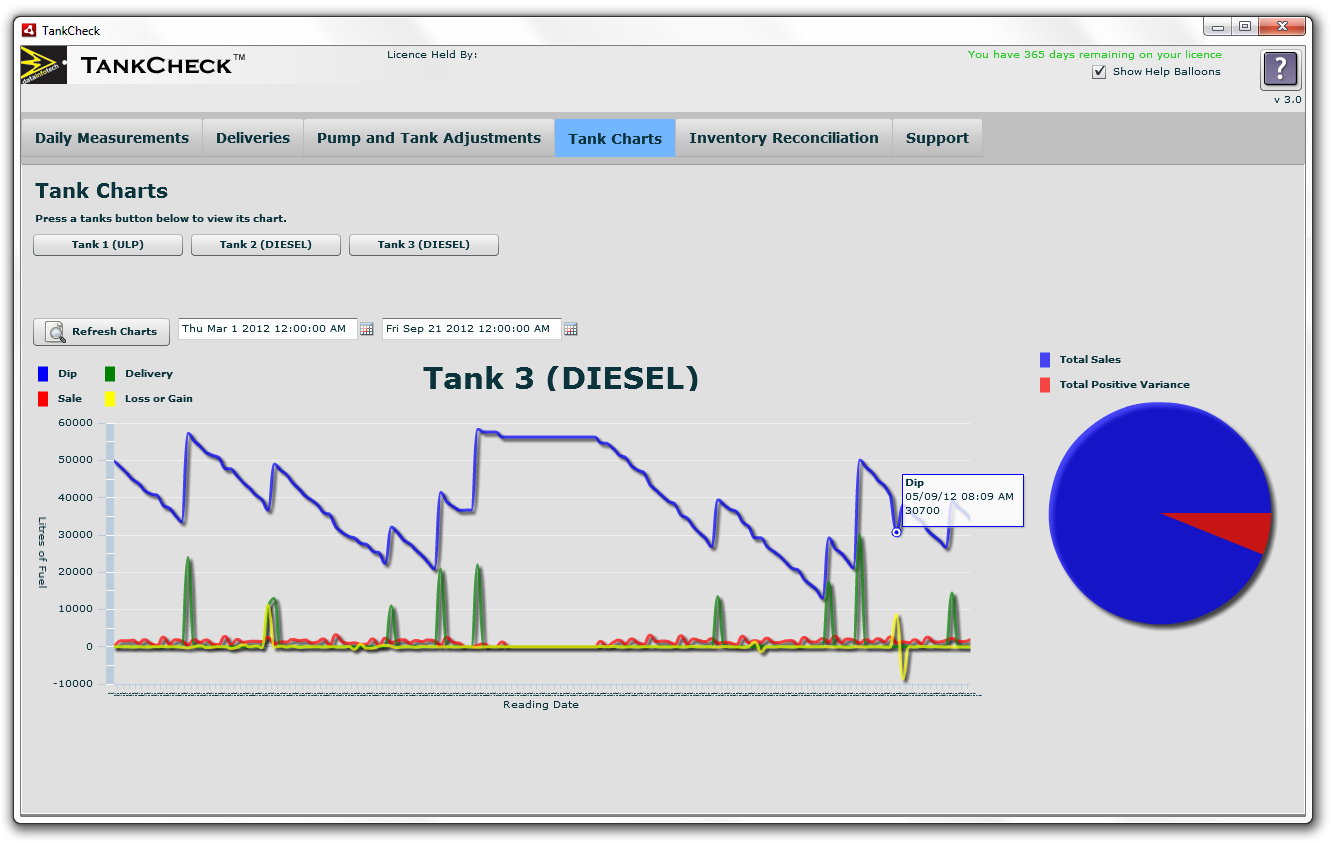
Tank Charts are simular to the existing inventory reconciliation, presenting Dips, Deliveries, Sales and any loss or gain in the data collected but this information is presented in easy to analyse charts.

A verry simple yellow line representing loss or gain will quiclky identify errors for resolve while giving a easy to understand representaion of the other activities of each tank.

For more information about Tank Charts see the help file within TankCheck or read About TankCheck online now.

TankCharts

Requirements:

TankCheck must first be installed. The download file cannot be used to create a new instal.

Adobe Air must be installed. If you are currently using TankCheck you already have Adobe Air installed and nothing further is required.

Note:

Your antivirus software must allow you to install software.

Login and Download

A Proactive Approach to UPSS

Approximately 30% of the contaminated sites regulated by the Department of Environment, Climate Change and Water (DECCW)1 under the Contaminated Land Management Act 1997 (CLM Act) are the result of leaking UPSS.

Contamination from leaking systems can be very expensive to clean up when it goes unchecked for a prolonged period.

A proactive approach to prevent leaks from occurring in the first place is in the interest of both site owners and the general community.

System Requirements

Windows


TankCheck™ was developed for use on the Microsoft Windows Operating System.

It does not work on other operating systems including Mac OS and Linux.

It has been fully tested on Windows 7 (32 and 64bit), but should also function on Windows 8, 8.1 and 10.